The Rozier-Billups Indictment
The rozier billups nba betting case is the most significant integrity event the NBA has faced in a generation, and it landed in the middle of the 2025-26 season with…

Deploy winning NBA totals strategies at UK bookmakers. Compare over/under lines, analyze team pace data, and claim top sign-up bonuses for the 2026 season.
 Available in US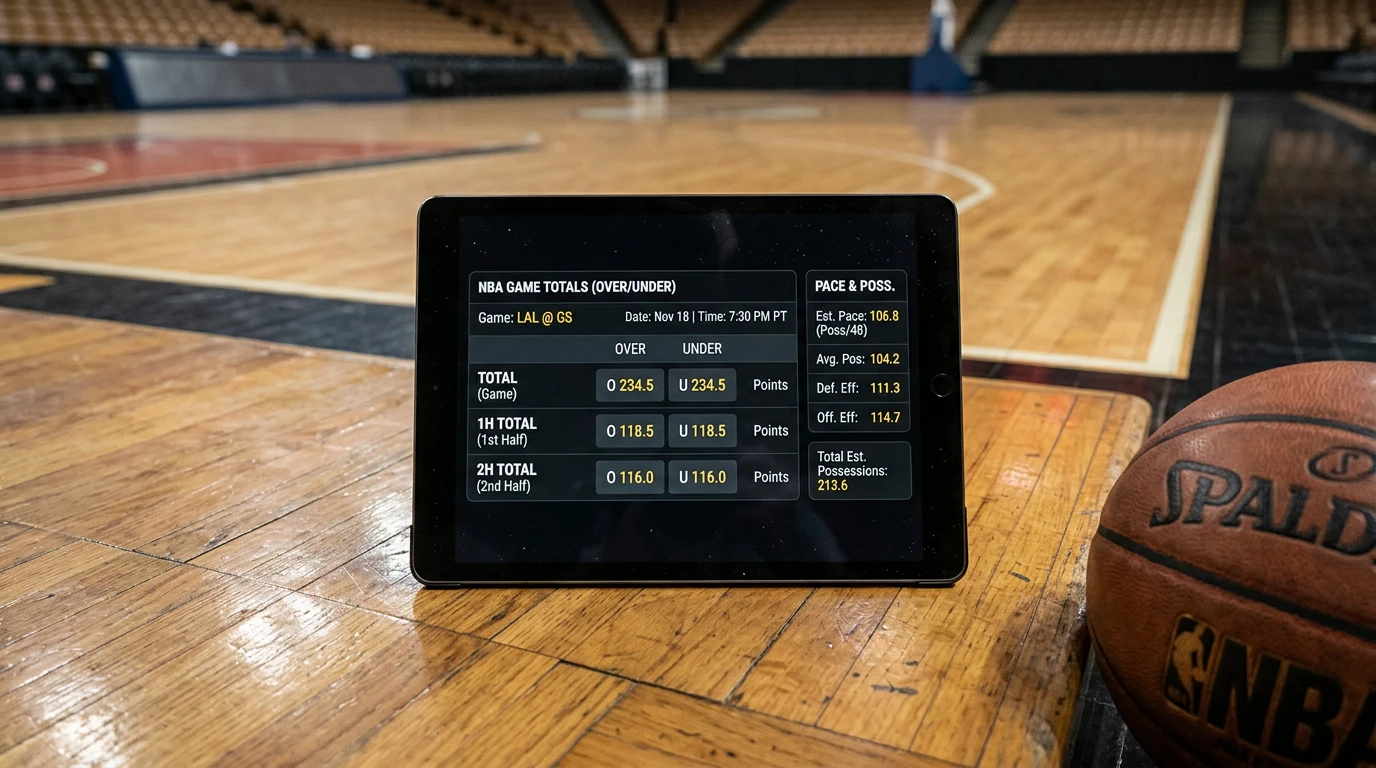
Table of Contents
For my first NBA season as a working analyst, I obsessed over moneylines and ignored totals. Big mistake. Once I started tracking results, the totals book was where my most stable edges showed up – not because the markets were soft, but because pace is genuinely predictable in basketball in a way that match outcomes rarely are. The over/under is the market that rewards process over hunch, and it deserves a lot more attention from UK punters than it usually gets.
On UK sites the market is labelled “Total Points” or “Over/Under” and works the same way you’d expect from any football goals market. The bookmaker sets a number – say 224.5 – and you choose whether the combined final score finishes above or below it. Prices are typically 10/11 either side, decimal 1.91, American -110. Overtime counts toward the total in standard NBA over/under markets, which is something to remember when you’re watching a tight fourth quarter at 222 and wondering whether an extra period will tip you over. If a full-game total seems too unpredictable, breaking the game down into NBA quarter and half betting markets can help isolate specific tempo advantages.
The total is not a vibe. It’s a number generated by combining each team’s offensive rating, each team’s defensive rating, the projected number of possessions, and a handful of fade-and-injury adjustments. Once you understand the recipe, the line stops feeling arbitrary and starts looking like a calibration exercise you can argue with.
Offensive rating is points scored per 100 possessions; defensive rating is points conceded per 100 possessions. A team averaging 118 offensive against a team conceding 115 defensive gives you a single-side expectation in the high 110s. Combine both team projections, scale by the expected number of possessions, and you arrive at the model number. UK bookmakers then bake in their margin and post a line slightly above or below the model output depending on which side the public is leaning.
What’s worth pricing in for British punters is the scale of this market. Basketball – the NBA plus US college – already accounts for roughly 28% of US national sports betting handle, which means American sportsbooks have spent years tightening their NBA totals models with vast amounts of data. UK books often pull from the same model providers or wire-house sources, which is why UK over/under lines tend to track US lines closely for marquee games. Where the UK market lags is on lesser fixtures – Tuesday-night matchups between two non-playoff teams – where lines can sit five or six minutes out of date during the European afternoon.
The remote betting sector that holds these markets is significant: UK Remote Casino, Betting and Bingo gross gambling yield reached £7.8 billion for April 2024 to March 2025, up £900 million year-on-year. NBA totals are a thin slice of that, but the volume is enough that the largest UK operators run sharp models on featured games. Smaller books, less so.
Here’s the most useful concept I can give you for NBA totals: possessions per game is the single biggest driver of where the line lands, and pace is more stable than most punters realise.
An NBA possession ends with a made basket, a missed shot that ends with a defensive rebound, a turnover, or a foul that sends the other team to the line. Each team gets roughly equal possessions per game because basketball is fundamentally a one-for-one sport. The total number of possessions in a game – the pace – varies between teams by about 4 to 7 possessions per 48 minutes. A high-pace matchup might run 105 possessions; a slow grind might run 95. Multiply those numbers by the combined offensive efficiency and you can see why two teams that play at different tempos produce wildly different game totals.
The trap is treating pace as if it’s set by the faster team. It isn’t. When a fast team plays a slow team, the average lands in the middle and skews slightly toward the team that controls more of the game’s late-clock possessions. A Boston-versus-Memphis fixture where Boston wants to push pace and Memphis wants to walk it up will usually land closer to Memphis’s preference, because the slow team controls the half-court possessions that dominate the back end of games.
Injuries to specific roles change pace asymmetrically. If a starting point guard is out, ball movement slows and pace drops. If a rim-protecting centre is out, the opposing team scores faster on each possession, which raises efficiency without changing pace. The total moves up. Subtle, but it shows up in the line if you watch closely.
Picture the scenario – it’s 7 PM UK time, you’ve already locked in your over on a 9 PM tip-off, and at 8:15 a Bleacher Report alert tells you the home team’s starting power forward is downgraded to “doubtful”. What do you do?
The answer depends on which side of the total he affects. A starting power forward who shoots 35% from three and offers spacing without elite rim-protection is mostly an offensive engine. His absence drops the home team’s projected points but doesn’t move the opposing team’s much. The line will move down – maybe a full point on a marquee fixture, more on a thin-market evening game. If you took the over at 224.5 and the new line is 222, your bet looks worse on paper than it did when you placed it, because the implied probability of the over has dropped.
The smart move depends on your live cash-out availability and your conviction on the original read. UK bookmakers offer dynamic cash-out on most NBA totals, and the cash-out value will reflect the new market line, not your original entry. If you’re confident the late-news reaction is overdone – which happens more than you’d expect on third-string players – you sit. If you think the line move is correctly pricing in the loss, you cash out for whatever the book offers and move on.
Late lines respond fastest in the final 90 minutes before tip-off. UK punters who can watch the market during the evening have a real edge over morning-only bettors, because the most actionable information arrives close to game time. Beat-reporter Twitter feeds and team injury reports drop late and move the number.
Quarter and half totals are where I send punters who are starting to find the full-game number too noisy. Smaller windows, less variance from a single hot quarter, and a fundamentally different settlement rule that catches a lot of people out.
First-quarter totals are set lower than full-game totals divided by four, because teams tend to feel each other out early and offensive efficiency climbs as the game progresses. A typical first-quarter total might sit around 56.5 while the full-game total is 228.5 – multiply 56.5 by four and you get 226, two points shy of the game number. That gap exists because pace and efficiency genuinely rise after the opening minutes.
Second-quarter totals adjust for substitution patterns – bench units typically score more efficiently against tired starters. Third-quarter totals are the highest scoring window on average, which is why “second-half” totals occasionally trade higher than first-half plus quarter projections would suggest. The key settlement rule is that quarter and half totals are normally based on regulation time only. Overtime does not count toward quarter totals. If a game goes into overtime and you’re holding a fourth-quarter under, the bet has already settled at the end of regulation – overtime is its own market. The same applies to half totals. Discover the most competitive totals and game props at our expert NBA betting portal.
That rule trips up so many UK punters who are used to spread and full-game total markets where overtime is included. Read your bet slip. If it says “Regulation Time” or “End of 4th Quarter” next to the market name, you know which rule applies. For a fuller breakdown of how these period markets settle and the cases where overtime overlaps with the full game, the quarter and half totals markets for the NBA walk-through covers each scenario.
The rozier billups nba betting case is the most significant integrity event the NBA has faced in a generation, and it landed in the middle of the 2025-26 season with…
NBA prediction markets sit in an awkward space in the UK betting…
The NBA London game betting cycle in 2026 sat at a strange…
I spent my first NBA betting season ignoring the vig because I…
