NBA Cash Out and Early Payout
The first time I cashed out an NBA bet I felt clever for an hour, then watched the bet I'd cashed go on to win and felt foolish for two…

Minimize bookmaker margins by understanding NBA vig and hold percentages. Compare low-vig UK sportsbooks and claim exclusive bankroll-boosting promotions.
 Available in US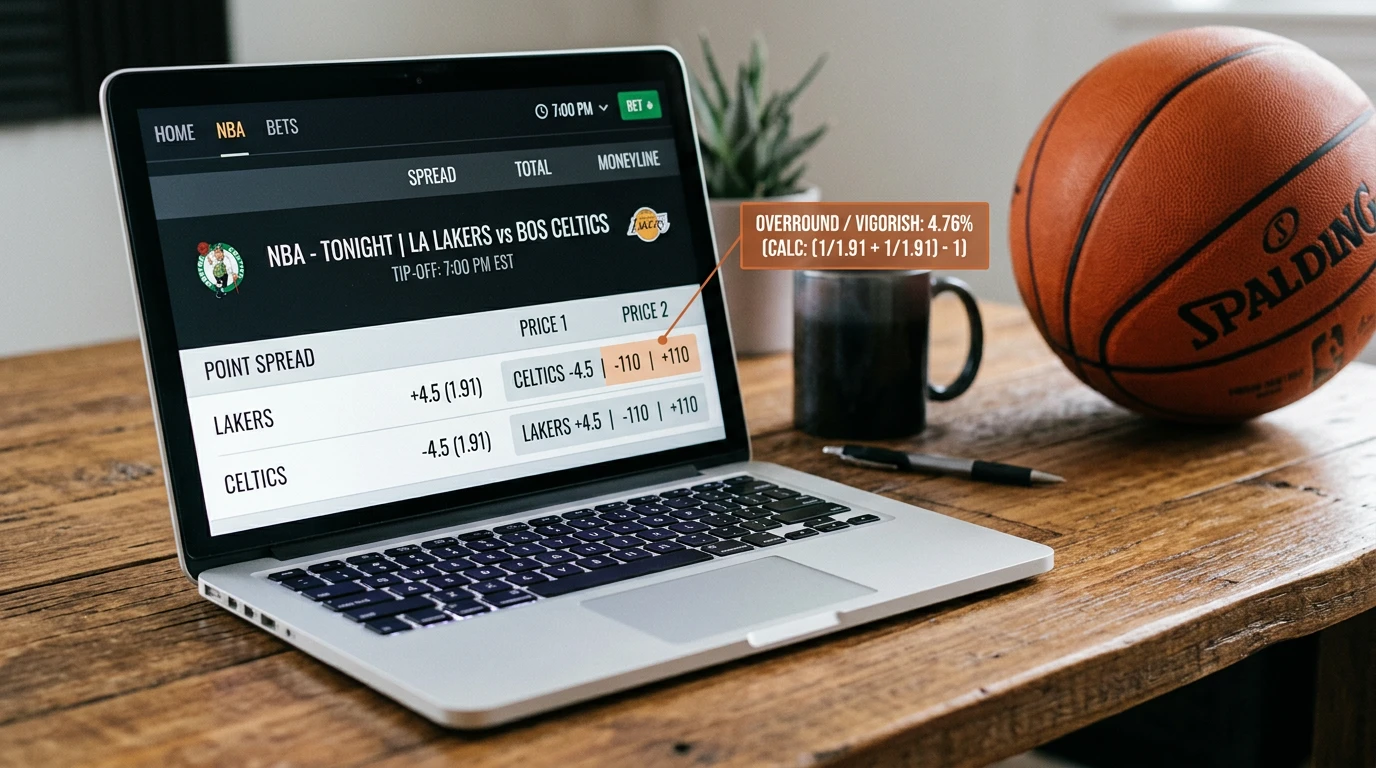
Table of Contents
I spent my first NBA betting season ignoring the vig because I didn’t know what it was. By the end of that season, I’d worked out that I was paying about 5% on every spread bet I placed and roughly twice that on player props. That was the moment I started taking the maths seriously, and it’s the moment that separated betting as gambling from betting as a craft. Vig is the most important number in NBA betting, and almost nobody in the UK guide ecosystem explains it properly.
Vig – short for vigorish, also called “juice” or “hold” – is the bookmaker’s margin on a market. It’s the price you pay for placing a bet at this operator, baked into the odds rather than charged as a separate fee. Every market on every UK bookmaker has a vig. Some are tight, some are wide, and learning to spot the difference is the practical foundation of getting better at NBA betting.
The terminology is messy because the US and UK industries use slightly different words for the same concept. Let me untangle it.
Vig refers to the bookmaker’s margin built into the odds. On a two-way market like an NBA spread at -110 on both sides, the vig is roughly 4.5%. You’re being asked to risk £110 to win £100, when the fair equivalent at exactly 50/50 odds would be £100 to win £100. That extra £10 of risk is the vig.
Hold percentage is the bookmaker’s expected revenue as a share of total stakes, given a balanced book. It’s a forward-looking measure of margin. On the same -110/-110 spread, the theoretical hold is roughly 4.55%, calculated as the vig divided by total implied probability. The 4.5% you “lose” to the vig and the 4.55% hold the bookmaker captures are the same money, viewed from different angles.
Margin is the broader concept. Bookmakers talk about market margin to mean the difference between 100% and the sum of implied probabilities across all outcomes. A two-way market with implied probabilities summing to 104.55% has a 4.55% margin. A three-way football market with implied probabilities summing to 107% has a 7% margin. NBA betting is overwhelmingly two-way, so margins are smaller than on football’s three-way match-result markets, but the cumulative effect across many bets is just as significant.
None of these terms are exotic. They all describe the same fundamental thing: the bookmaker’s cut. The reason there are three names is historical accident across different gambling cultures – American bookmakers call it vig, British bookmakers prefer margin, and analytics-driven traders use hold. Use whichever you like, as long as you can calculate it.
Here’s where the maths becomes practical. Take any two-way NBA market. Convert each side’s odds to implied probability. Add them. The amount above 100% is the overround. Divide the overround by the total to get the hold percentage. That’s the entire calculation.
Walk through a typical NBA spread: Lakers -3.5 at 10/11, Warriors +3.5 at 10/11. 10/11 is decimal 1.91. Implied probability = 1 ÷ 1.91 = 52.36%. Both sides at 52.36% sum to 104.71%. Overround = 4.71%. Hold percentage = 4.71 ÷ 104.71 = 4.50%. That’s a typical UK NBA spread market.
Now compare to a player prop: Steph Curry over 27.5 points at 10/11, under 27.5 at 5/6. 10/11 is decimal 1.91; 5/6 is decimal 1.83. Implied probabilities = 52.36% and 54.64%. Sum = 107.00%. Overround = 7%. Hold percentage = 7 ÷ 107 = 6.54%. Significantly higher than the spread, which is why props are worse value in vig-adjusted terms.
Now compare to a typical NBA moneyline: Bucks -260, Hornets +220. -260 means risk 260 to win 100, so implied probability = 260 ÷ (260+100) = 72.22%. +220 means risk 100 to win 220, so implied probability = 100 ÷ (220+100) = 31.25%. Sum = 103.47%. Overround = 3.47%. Hold percentage = 3.35%. Tighter than the spread, which is unusual but reflects the bookmaker’s preference for lopsided moneylines that drive recreational money toward the favourite.
Once you’ve calculated overround on five or six markets at one operator, you’ll start to see patterns. Featured games have tighter vig than midweek fixtures. Spreads tend to run tighter than totals. Player props run wider than team markets. Same-game parlays run wider than any of them. The pattern is consistent enough that you can predict the hold on a new market before checking the maths.
The structural story of NBA betting margins is that they’re rising. Across US sportsbooks, average hold percentages have climbed from roughly 6.7% in 2018 to over 9% in the 2024-2025 cycle. That’s a meaningful drift upward, driven by three forces: increased prop coverage, growing reliance on bet-builder products with built-in correlation margins, and operator consolidation.
UK NBA holds haven’t risen quite as fast, partly because the UK market remains more competitive on featured games and partly because UK punters have alternatives in football and horse racing that they can switch to if NBA pricing gets too tight. The total online GGY across the UK remote sector grew 8% year-on-year to £1.42 billion in Q2 2025, which reflects volume growth more than margin growth – operators that compress margin to retain customers tend to win volume rather than per-bet revenue.
What’s worth tracking on a UK operator’s NBA pages is how the hold percentage changes through the season. Pre-season vig tends to be wider because the model is less confident. Mid-season hold compresses as the model calibrates. Playoff hold tightens further on featured games – the operator wants headline volume on marquee fixtures – but widens on niche futures because long-dated risk costs more to hold.
Some operators publish their average hold; most don’t. UK transparency rules don’t require disclosure, so the only way to gauge an operator’s pricing is to calculate the hold yourself across a representative sample of markets. I’d recommend a check on five spread markets, five totals, five moneylines, and five player props before you commit to an operator as your primary book. The pattern across those 20 markets tells you more than any aggregator rating does.
The most useful applied skill in NBA betting is converting a vigged price into a no-vig fair price. Once you can do it, you can quickly assess whether any line is offering you positive expected value relative to your read on the matchup.
The method is straightforward. Calculate implied probabilities for both sides, sum them, then divide each side by the total. That gives you each side’s share of the joint probability, scaled to sum exactly to 100%. The result is the bookmaker’s no-vig fair line.
Take the earlier Lakers spread: implied probabilities 52.36% and 52.36%, summing to 104.71%. Each side’s no-vig probability is 52.36 ÷ 104.71 = 50.00%. So the bookmaker’s fair line on this spread is exactly 50/50 – the operator has no preference between the two sides. If you believe the Lakers cover more than 50% of the time, you have positive EV. If you think the true probability is exactly 50%, you’re paying the vig for nothing.
On the Curry prop example: implied probabilities 52.36% over and 54.64% under, sum 107%. No-vig: 48.93% over and 51.07% under. The bookmaker leans slightly under, which is informative – they think Curry goes under 27.5 more than half the time, after stripping out their margin. If you have a model that says Curry hits the over 53% of the time, you have edge on the over despite the 6.54% hold. The no-vig conversion makes that comparison possible.
What removing the vig doesn’t tell you is whether your read is right. The fair line is the bookmaker’s view of the world. To beat it, you need a different view that’s actually correct. Closing line value – measuring whether you tend to take prices that look good versus where the line ends up – is the practical test, and the CLV is the practical test for beating the vig piece walks through how that measurement works in NBA-specific terms.
The first time I cashed out an NBA bet I felt clever for an hour, then watched the bet I'd cashed go on to win and felt foolish for two…
I've been burying small futures positions in NBA championship markets for nearly…
For my first NBA season as a working analyst, I obsessed over…
A two-way contract NBA betting scenario looks innocuous on a UK punter's…
