The Rozier-Billups Indictment
The rozier billups nba betting case is the most significant integrity event the NBA has faced in a generation, and it landed in the middle of the 2025-26 season with…
Track your NBA closing line value (CLV) to boost long-term ROI. Compare odds movements at top UK bookmakers and secure massive sign-up bonuses for 2026.
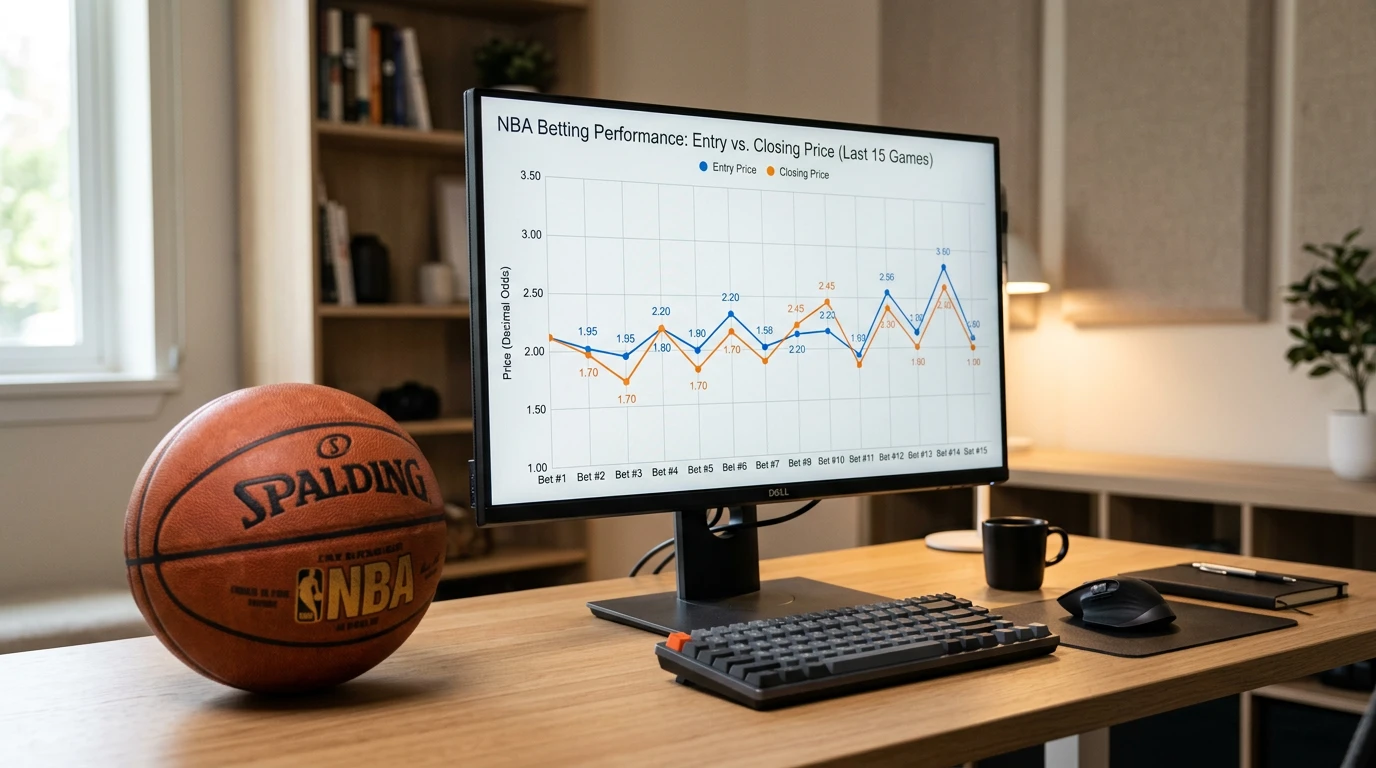
Table of Contents
If you’d asked me five years ago what I tracked to know whether I was getting better at NBA betting, I’d have said “profit and loss” without hesitation. If you ask me now, I’d say closing line value, and I’d back-date that answer to about two seasons after I should have known better. CLV is the single best diagnostic UK punters have for whether they’re actually finding value or merely riding variance, and it’s the metric I wish someone had pushed me toward in my first year. Andrew Rhodes, Chief Executive of the UK Gambling Commission, framed the broader UK landscape this way: “Recent data published shows that total gross gambling yield (GGY) is at its highest ever level at £15.6bn. Participation in gambling has remained stable at 48%, just under half of the adult population in Great Britain.” Inside that growing market, the punters who improve year-over-year are the ones tracking CLV. The ones who don’t tend to spend their profits and explain away their losses. To consistently beat the closing price, you must become proficient at reading NBA line movement before tip-off and reacting instantly to injury news.
Closing line value is the difference between the price you got on a bet and the final line at the moment the bookmaker closes the market. If you took the Heat at +150 two hours before tip-off and the closing line moves to +130, you have positive CLV – your entry price beat the close. If the line moves to +170, you have negative CLV – the market is telling you the price you took was wrong.
The closing line is the most efficient price the bookmaker produces for a given event. It’s the number that emerges after all the morning money has come in, all the late-breaking injury news has been priced, and all the sharp action from professional bettors has nudged the line into shape. It’s the bookmaker’s best guess at the true probability, multiplied by their margin.
What makes the closing line useful as a benchmark is that it’s the consensus number across the entire market once price discovery has happened. The whole point of a betting market is that it converges on an efficient price as information accumulates and informed money pushes the line. The opening line is a guess. Lines through the day are revisions. The closing line is the synthesis.
This is why beating the close is a meaningful achievement. If the market – meaning all the bettors, sharp and recreational, plus the bookmaker’s own model – has settled on +130 as the right price for the Heat, and you took +150 earlier, you took a price that the market subsequently judged to be too generous. Either you saw something the market hadn’t yet processed, or you got lucky on timing. Across a large sample, the lucky-timing explanation drops out and what’s left is genuine edge.
Different operators close at slightly different times – some lock the market at tip-off, some at the first whistle, some a few minutes before. For practical CLV measurement, I use the last available price on the operator I placed the bet at, which keeps the measurement consistent.
The arithmetic is simple, but the discipline is the hard part. For each bet you place, record three numbers: the price you took, the closing price on the same market, and the no-vig fair probability at both moments.
Take the Heat example. You took +150, which is implied probability 100 ÷ 250 = 40%. The closing line was +130, implied probability 100 ÷ 230 = 43.48%. Your CLV is the difference in implied probability: +3.48 percentage points. On a £10 stake, that translates to roughly £0.87 of expected value captured at entry that you wouldn’t have got at the close.
If you do this for 100 bets and total up the expected value captured, you get a single number that summarises whether your timing and selection are adding value relative to the market. Positive total CLV across a meaningful sample tells you that you’re consistently taking prices the market subsequently disagrees with. Negative CLV tells you the opposite, regardless of whether the bets win or lose individually.
The growing UK online betting volume – Q2 2025 saw online GGY of £1.42 billion across the full remote sector, up 8% year-on-year – means that price discovery on NBA markets is sharper than it was even three seasons ago. More money chasing the same events tightens the closing line. So CLV measured today is a stricter test than CLV measured in 2020. A small positive CLV in the current market is more meaningful than a large positive CLV was five years ago.
For UK punters, the practical hurdle is recording closing lines. Most operators don’t make historic closing data easy to scrape. The workaround is to screenshot the closing odds at tip-off across the operators you use, or use a third-party aggregator that archives lines. The investment in record-keeping pays off after about 50 bets – that’s when patterns start to surface.
The reason CLV matters so much is that win rate is a noisy signal across small samples. The reason CLV is less noisy is that every bet contributes data about price quality, not just outcome.
Think about it this way. Two punters bet the same 100 NBA spreads at the same prices. Punter A wins 53 and loses 47, finishing slightly profitable. Punter B wins 49 and loses 51, finishing slightly underwater. Same prices, same picks. The difference is variance – which side covered on which night. If both bettors got the same closing line value on every bet, their long-run expected profit is identical, but their short-run results diverge.
CLV catches this. By measuring the gap between entry price and closing price, you’re effectively measuring the quality of every bet independent of whether it cashed. A bet placed at +150 that closed at +130 was a good bet, regardless of whether you won or lost. A bet placed at +150 that closed at +180 was a bad bet, regardless of whether you won or lost. Across enough samples, the win-rate noise smooths out and the CLV pattern is what’s left.
The structural reason CLV works is that the bookmaker’s hold percentage – currently averaging over 9% on US sportsbooks, having climbed from 6.7% in 2018, with UK operators running tighter but still meaningful margins – eats your edge slowly across thousands of bets. The only way to overcome the hold is to beat the closing price by enough to offset it. CLV is the direct measure of whether you’re doing that.
Here’s the uncomfortable truth – you can have positive CLV for 200 bets and still be down on profit. You can also have negative CLV for 200 bets and be up. The relationship between CLV and bottom-line profit is strong only across very large samples.
How large is “very large”? My honest answer, based on my own records and others I’ve seen, is that CLV becomes meaningfully predictive of profit at around 300 to 500 bets, and dispositive at around 1,000. Below 300, results are still dominated by variance. Between 300 and 1,000, CLV starts to look like a real predictor. Above 1,000, CLV and profit should converge to the same conclusion.
The patience implication is significant. If you bet 5 NBA games a week, 300 bets is over a year of betting. Most UK punters never accumulate enough data to draw firm conclusions about their own skill from results alone. CLV gets you to a conclusion much faster, because every bet contributes to the metric.
That said, results matter too – eventually. If your CLV has been consistently positive for 500 bets and your profit is still negative, something is wrong with your record-keeping, your stakes are too aggressive, or you’re being charged worse cash-out values than your peer group. CLV positive plus profit negative is a flag, not a vindication. Track line movements and find the sharpest odds across the leading NBA sportsbooks in the UK.
The reverse case is more interesting. CLV negative but profit positive means you’re getting lucky, and the timeline for that luck running out is shorter than you’d hope. Continuing to bet at negative CLV is a slow drain regardless of current profit. The path to improving CLV starts with reading the market better – for the practical mechanics, the how to read NBA line movement before tip-off piece walks through the signals worth tracking.